Reports & analytics
Your month at a glance, and what to do about it
Month-to-date sales against goal, a forecast-based month-end projection, average order value and the actions that matter today.
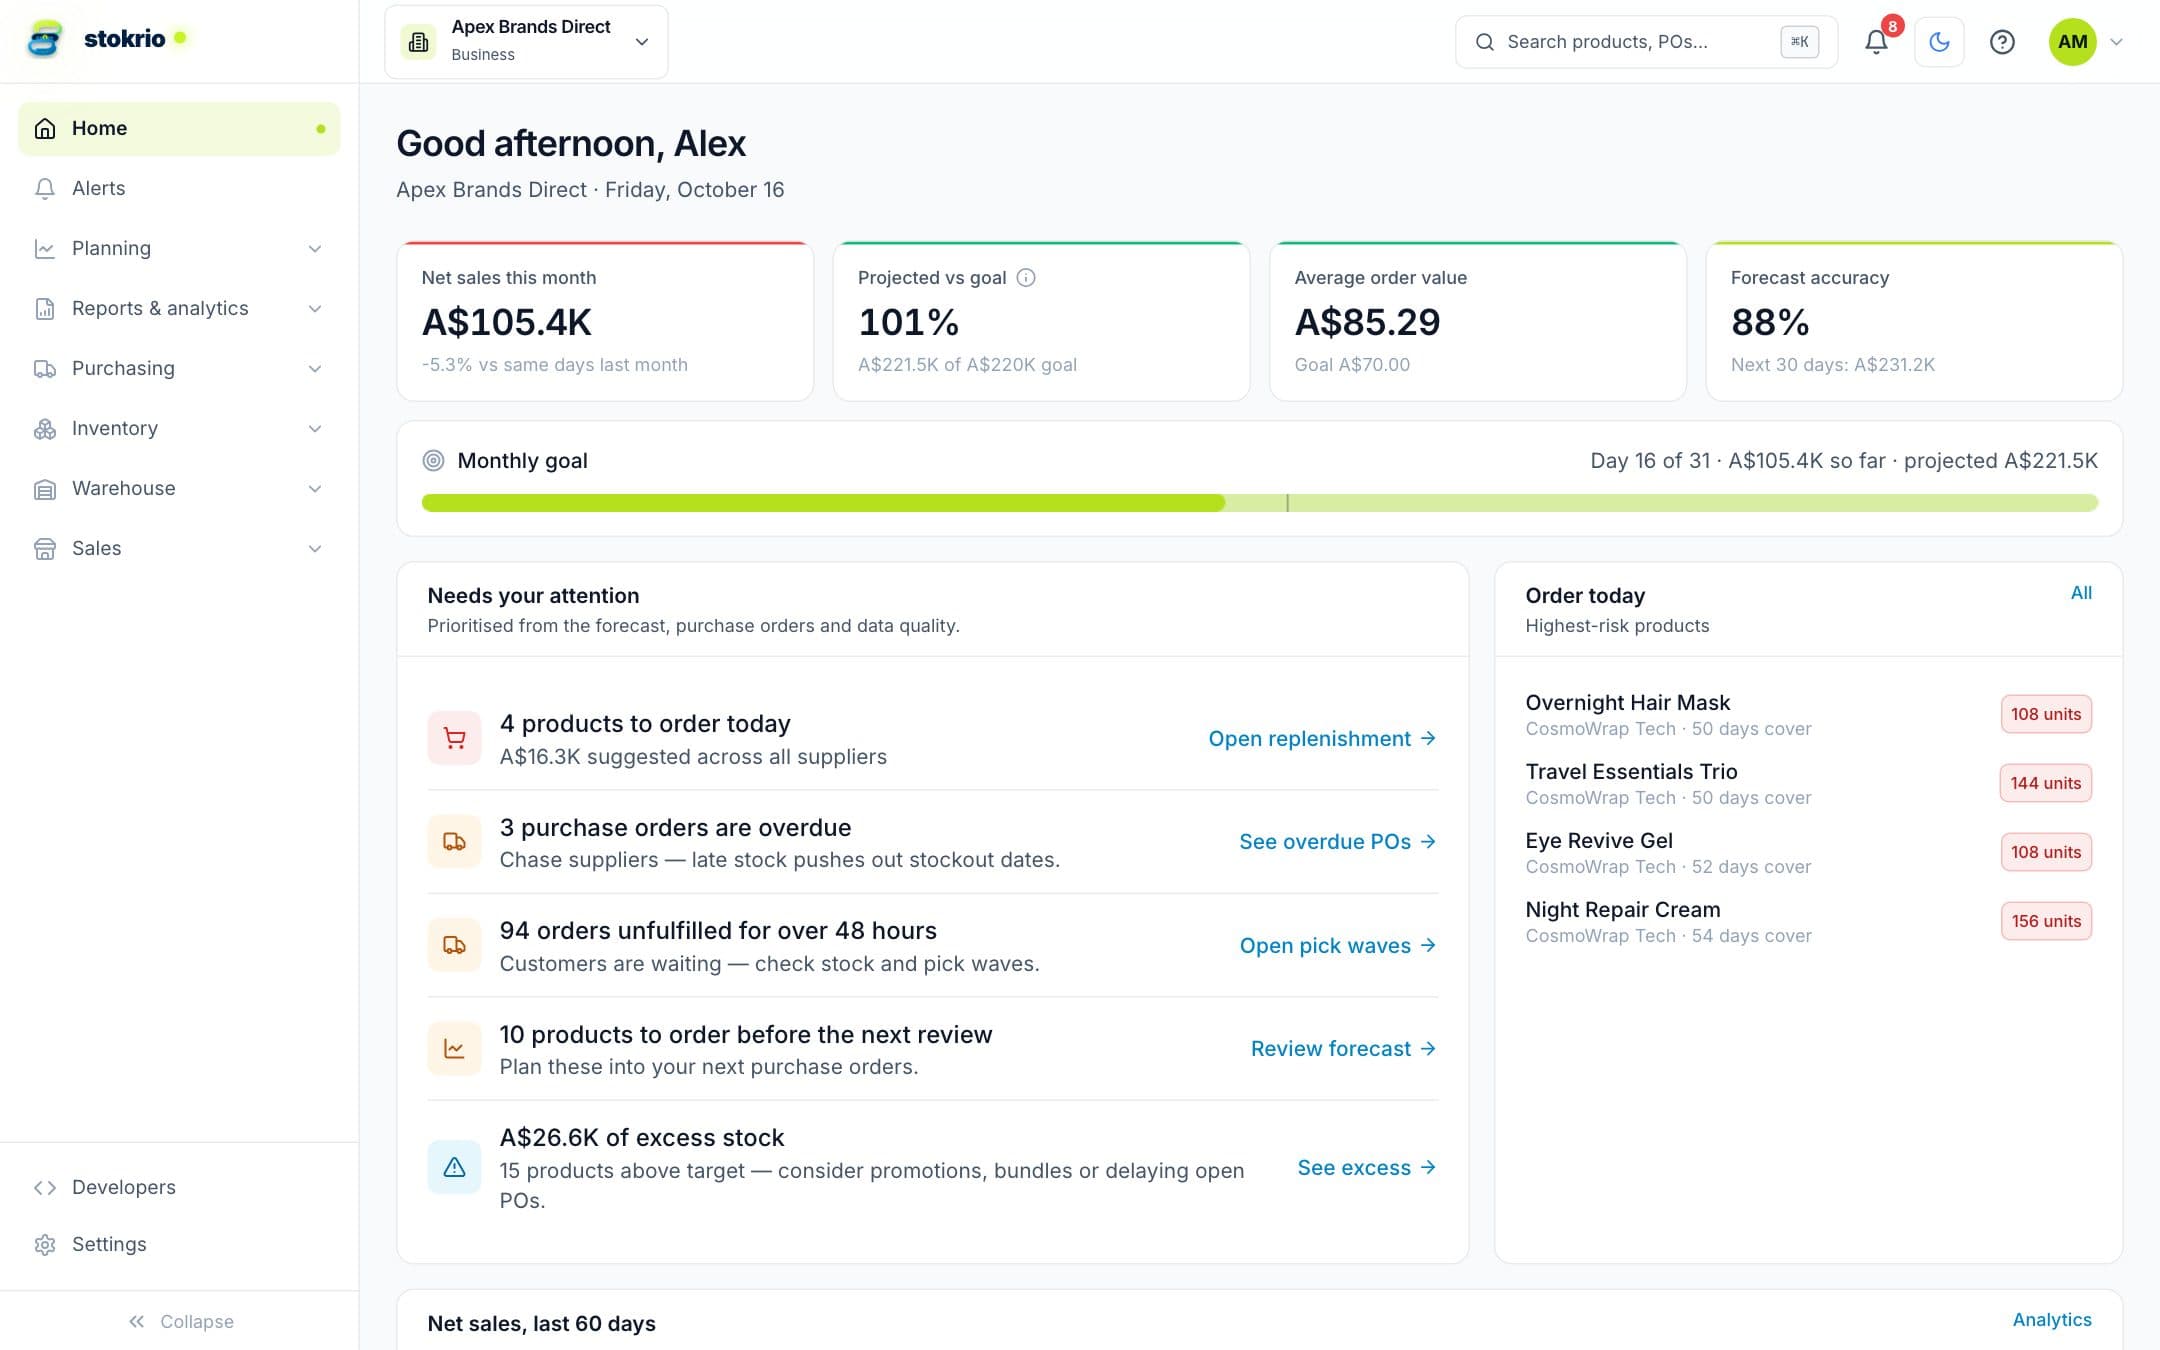
How sales analytics & goals works
Stokrio's home dashboard compares month-to-date net sales with a monthly revenue goal and projects the month end using the demand forecast. It shows AOV against an AOV goal, forecast accuracy and a prioritised list of actions: products to order, overdue purchase orders, unfulfilled orders and excess stock. The analytics page gives a 12-month executive view built from the same reports.
- Goals and pace
- Set monthly revenue and AOV goals; see progress and a projection to month end.
- Needs your attention
- Products to order, late POs, orders waiting over 48 hours and excess stock — each one click from the fix.
- Executive analytics
- Twelve months of sales, inventory value, turnover and in-stock rate in one view.
Frequently asked questions
How is the month-end projection calculated?
Works with
Inventory reports & analytics
22 inventory, sales, purchasing and forecast reports for Shopify brands: stockout risk, excess and dead stock, aging, ABC-XYZ, in-stock rate, sell-through, GMROI, supplier OTIF — with comparisons, CSV, PDF and scheduled email.
Learn moreDemand forecasting
Per-product demand forecasts for Shopify brands: 12 statistical models compete on each SKU's own history, stockouts are treated as missing demand, and seasonality is detected automatically.
Learn moreScreenshots use illustrative demo data, not customer results.
See Stokrio with your own data
Create a workspace in minutes. Connect Shopify or start with the API.